How to sniff USB traffic (capture USB data) using USBTrace ?
Introduction
USBTrace is a software-based USB protocol analyzer (USB analyzer) which can be used to capture/sniff/analyze USB protocol data exchanged between USB devices and the PC. The tool is mainly used by USB device driver, firmware developers & test engineers to analyze, debug and test the USB implementation. This article explains in simple steps how USBTrace can be used to capture USB protocol data.
USBTrace supports all versions of Windows starting from Windows 2000,XP. It supports all processor architectures (32 bit and 64 bit) and all versions of USB (low, high, full and super speed). USBTrace is a standalone software, it requires no other hardware/software components to run.
How to monitor USB ports using USBTrace
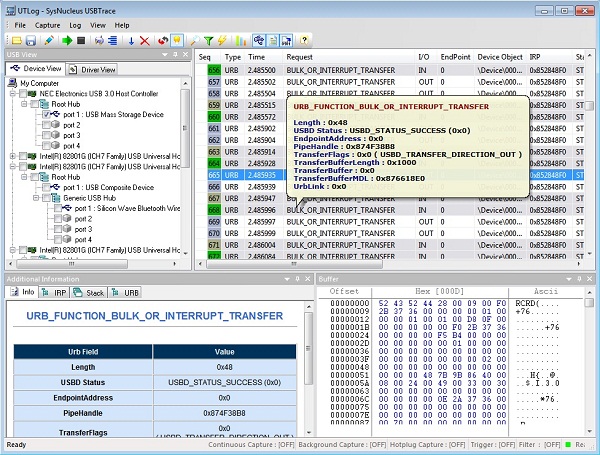
Image below shows the USBTrace user interface. In the top left pane (USB View) the USB devices and drivers present in your system are displayed. Devices are shown in tree format as per connection hierarchy. Towards the right of this pane is where the captured USB transactions are displayed (Log View). The lower left pane (Info View) shows details decoded information for each captured transaction. The lower right pane displays the data (Buffer View) associated with each captured transaction.

To start analyzing a device, check the box near the device name in the USB View and click the 'Start Capture' button (See Capture menu).

Once you start capture, captured USB protocol data will be displayed in the Log View as shown below.

Clicking on each captured USB transaction will load detailed decoded information in the Info View and its data contents in the Buffer View.


Know more
1. USBTrace Interative Demo
2. USBTrace Product Tour
3. Download and Try the free evaluation version
4. USBTrace Feature List
