USBTrace USB Analyzer for Windows
USBTrace USB Protocol Analyzer can be used to capture and analyze USB traffic on Windows machines. USBTrace can analyze USB protocol data at USB host controllers, hubs and devices. USBTrace USB Analyzer supports all USB implementations from USB 1.x to 3.0 (super speed).
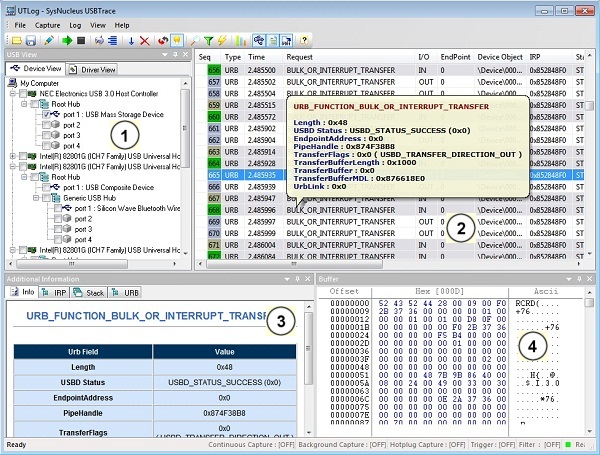
The protocol analyzer's user interface is as shown below.
USBTrace User Interface
| The USB View shows the USB devices (Host controllers, hubs and devices) and the USB drivers present in your system. |
| The Log View is where all captured USB protocol requests are displayed. |
| The Information View displays decoded information about the selected USB request. It also displays the IRP, URB & IO_STACK_LOCATION structures associated with the selected request. |
| The Buffer View displays the data buffer, if any, associated with the USB request. |
To capture USB traffic, select the USB device or driver from the USB View pane and click the Start Capture toolbar button (or select Capture menu > Start Capture). Captured USB transactions will appear in the Log View. Clicking a transaction in the Log View will display its decoded information in Info View and data in Buffer View.
In addition to capturing USB traffic of already plugged in devices, USBTrace also allows you to capture enumeration time USB protocol data of newly plugged in devices. See USB Enumeration Explained.

